The TrueDx evidence-rich report

A pathology opinion you can see—not only read.

Representative slide regions, annotations, maps, and measurements connect the written interpretation to visual evidence patients can understand and oncologists can inspect. The reviewing pathologist verifies the relevant findings and remains the diagnostic authority who signs the final report.

What the computational analysis is

An analysis of algorithmic output computed on a whole-slide image. Every generated statement resolves to a named artifact and, where a judgment is proposed, is shown against the field that most supports it and the field that least supports it.

It is not a signed-out diagnosis and carries no diagnostic authority until reviewed by the reporting pathologist.
01 / Specimen

Case identity and source

Slide
De-identified WSI identifier
Source
Originating lab or repository
Sample
Specimen and block relationship
02 / Slide acquisition

Image fitness and scale

Dimensions
21,911 × 21,753 px
Resolution
0.2527 µm/px · 40×
Physical extent
5.54 × 5.50 mm
03 / Analysis aperture

Exactly what was analyzed

Tissue map
43 cores · 4.229 mm²
Nuclei map
62 cores · 16.61 mm²
MIL subtype
325 patches · 20×
What “evidence-rich” means

More than a narrative report.

A conventional report records the pathologist's conclusion. An evidence-rich report also presents the computational and visual observations behind that conclusion in a form the care team can inspect.

1Model-derived evidencePredictions, maps, counts, measurements, and representative fields.
2Pathologist interpretationMicroscopic findings, diagnostic reasoning, limitations, and final impression.
3Traceable provenanceModel version, parameters, tissue coverage, artifact lineage, and reviewed regions.
Six evidence layers

One slide, examined from complementary angles.

Each layer answers a different question. None should be treated as a stand-alone diagnosis.

01

Prediction heatmap

Shows where a classification model found evidence supporting—or arguing against—a predicted category across slide patches.

  • Predicted class and calibrated score
  • Spatial attention or evidence map
  • Highest-support and strongest-counterexample fields
02

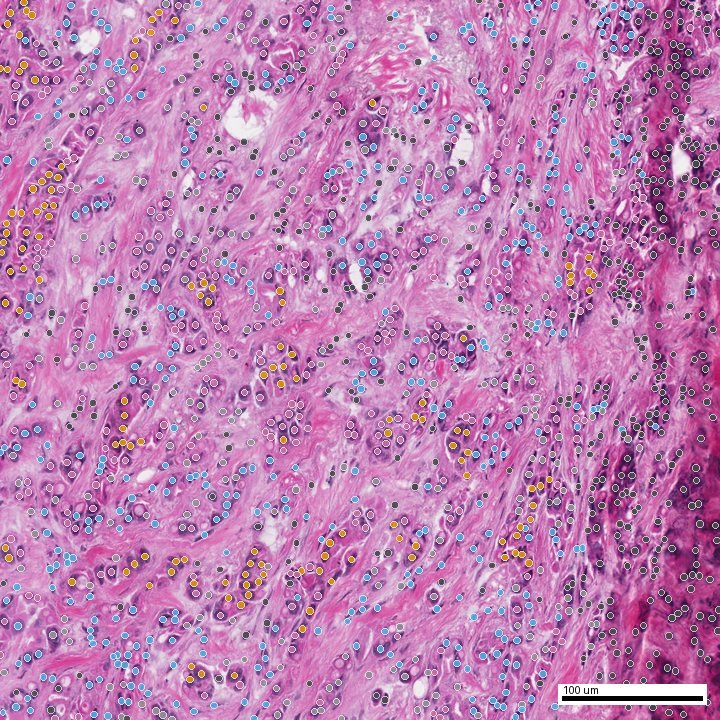
Nuclei map

Segments individual nuclei and assigns model-derived morphological classes across evaluated tissue regions.

  • Total nuclei and analyzed area
  • Neoplastic, stromal, inflammatory and other classes
  • Counts, proportions, density and heterogeneity
03

Tissue map

Separates tissue architecture into computational regions such as tumor, stroma, inflammation, necrosis, and other tissue.

  • Area fractions and coverage
  • Tumor–stroma ratio
  • Regional distribution and representative fields
04

Biomarker map

Displays predicted marker intensities or phenotypes from a validated in-silico model when that analysis is available.

  • Marker or phenotype distribution
  • Cell counts and regional co-localization
  • Agreement and divergence from morphology
05
Aa

Microscopic findings

Converts relevant visual and quantitative observations into reviewable pathology findings.

  • Cellular composition
  • Tumor-infiltrating lymphocytes
  • Necrosis and tissue architecture
06
↳

Artifact provenance

Records how every model-derived number and image was produced so it can be traced and audited.

  • Model name, version and parameters
  • Analyzed area, tiles, magnification and resolution
  • Artifact dependencies and source regions
Interactive evidence comparison

Move the slider from H&E to model overlay.

Each comparison keeps the original field and generated evidence in the same coordinate system. Drag horizontally to inspect exactly what the model added.
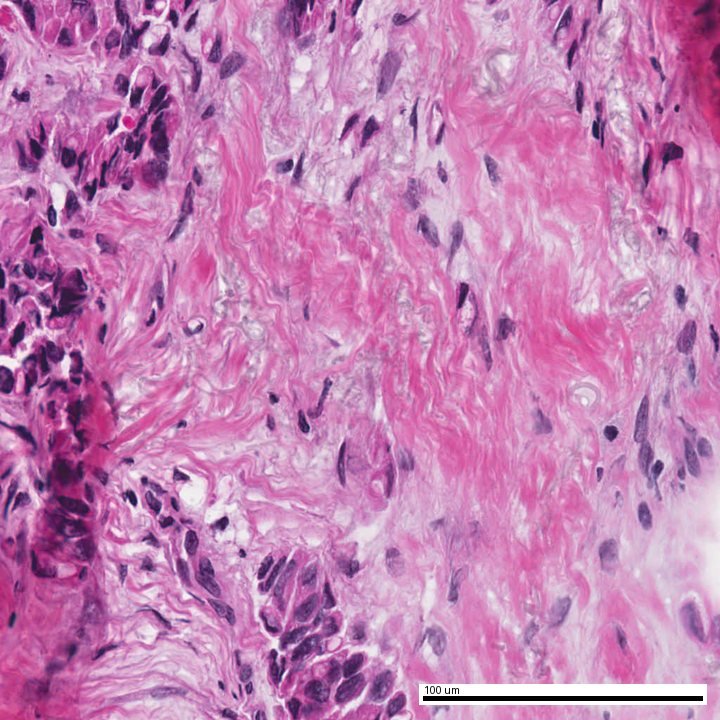
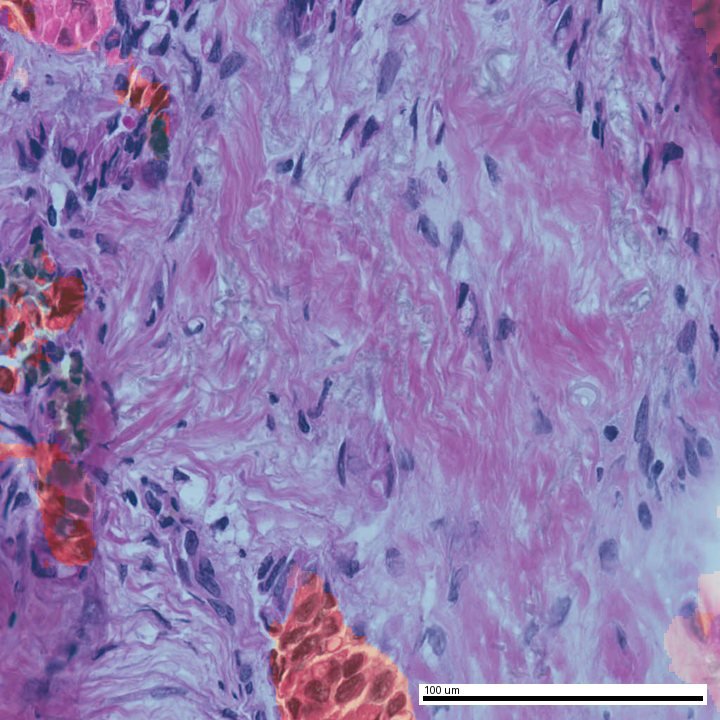
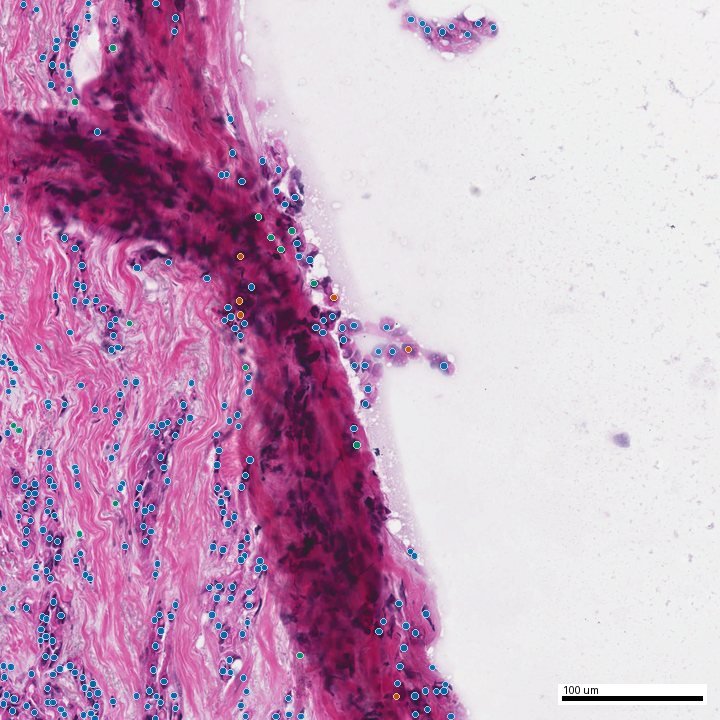
Tissue architecture

Tumor–stroma evidence

TSR
Illustrative H&E field used for tumor-stroma analysis
AI tissue overlay on the same field
H&EOverlay

Representative field supporting a stroma-predominant pattern.
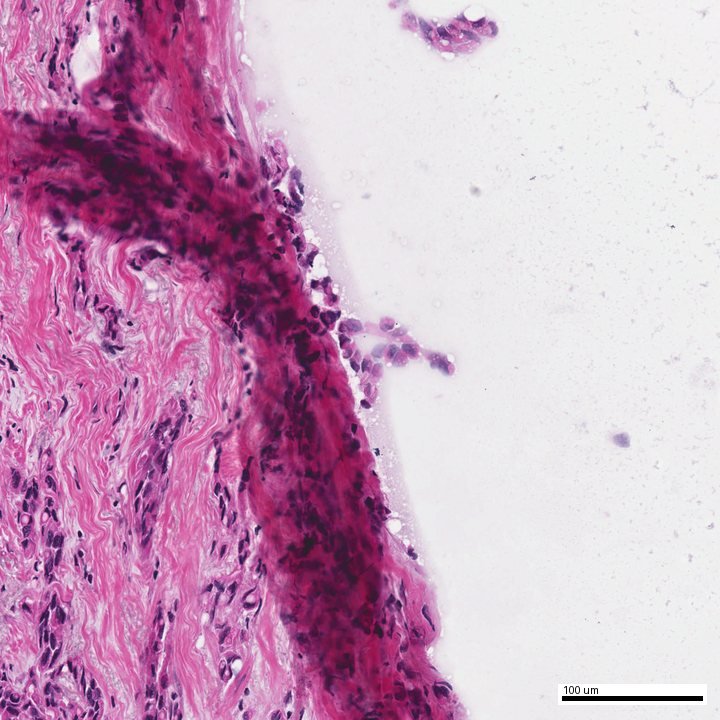
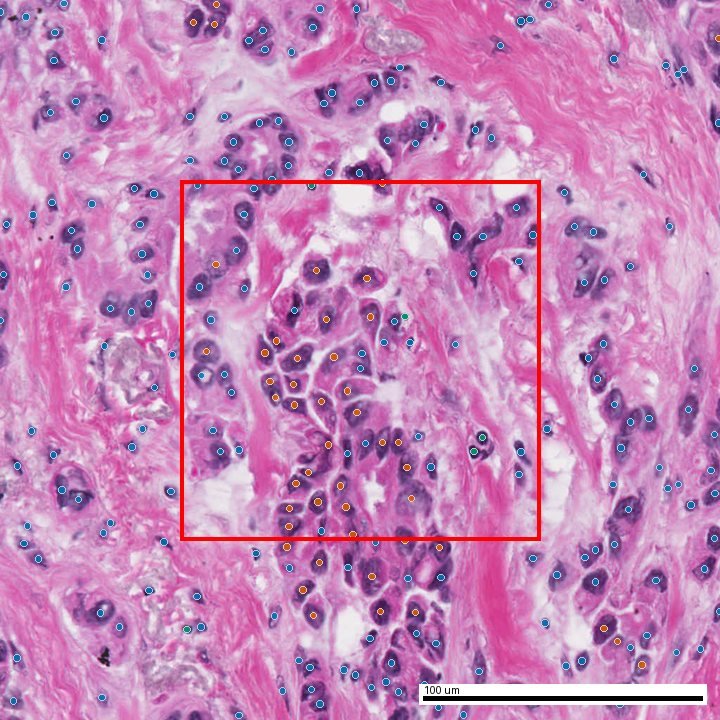
Cellular evidence

Tumor-infiltrating lymphocytes

TIL
Illustrative H&E field used for lymphocyte analysis
AI nuclei overlay on the same field
H&EOverlay

Field selected for the densest lymphocyte and plasma-cell evidence.
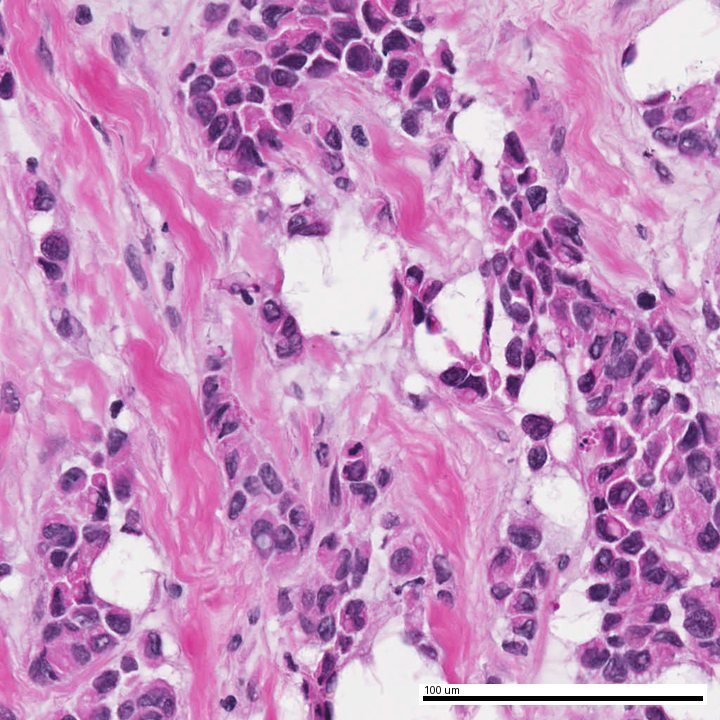
Tissue finding

Focal necrosis

NEC
Illustrative H&E field used for necrosis analysis
AI necrosis overlay on the same field
H&EOverlay

Best-supported necrosis field among adequately filled analyzed tiles.
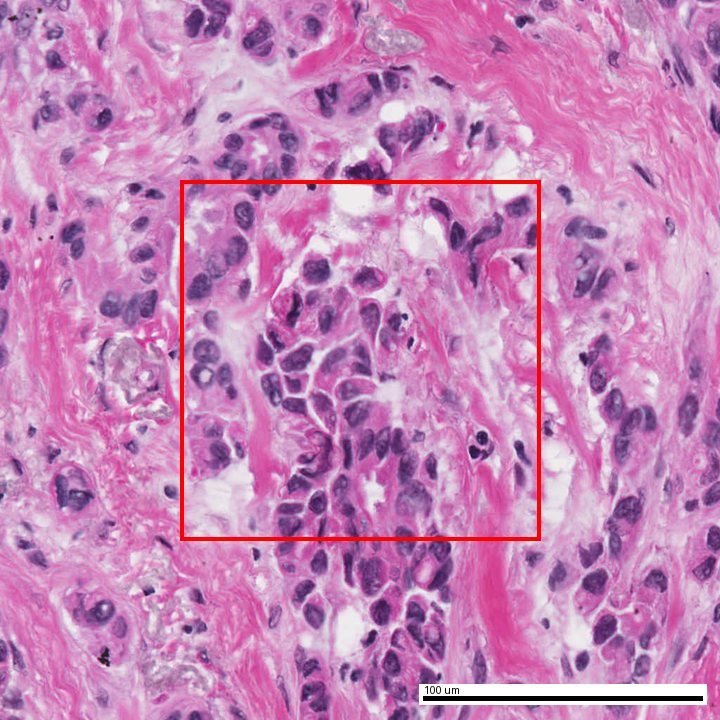
Attention-based MIL

Subtype evidence

MIL
Illustrative H&E patch used for subtype analysis
AI subtype evidence overlay on the same patch
H&EOverlay

Patch carrying strong model evidence for the candidate subtype.
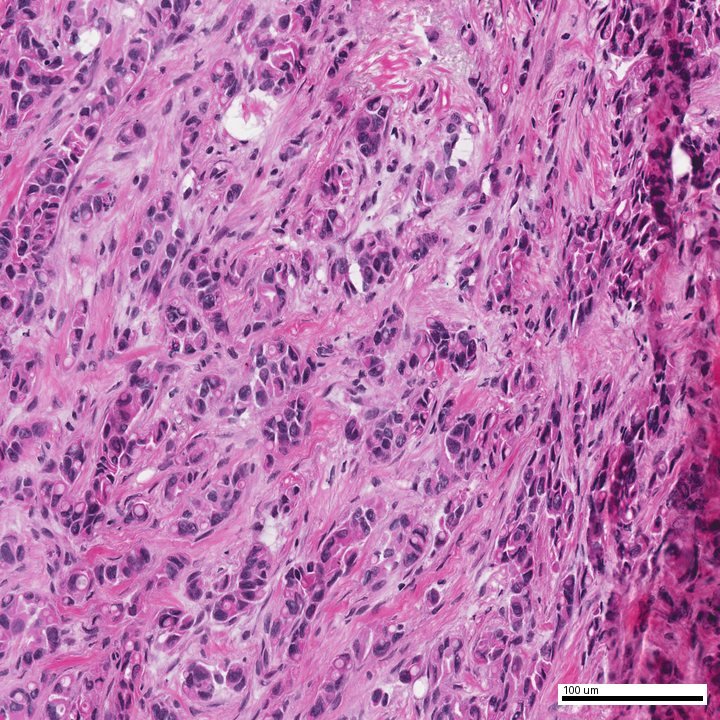
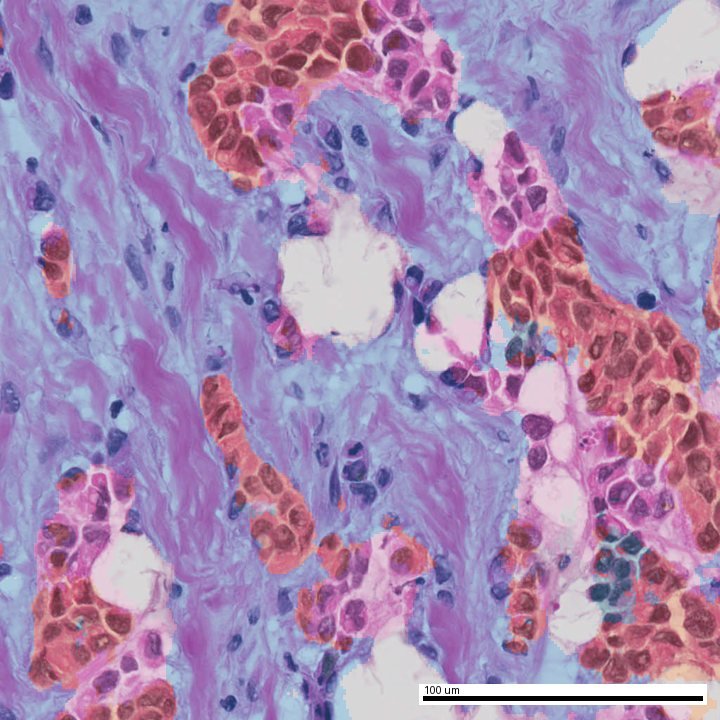
In-silico immunophenotype

Virtual phenotype map

V-IF
Illustrative H&E field used for virtual phenotype analysis
Predicted virtual phenotype overlay on the same field
H&EPredicted

Region where morphology and predicted phenotype show close agreement.

Images are extracted from the supplied de-identified demonstration report. Overlays are model-derived artifacts for pathologist review and are not independent diagnoses.
Ancillary studies

Model-derived studies that extend the microscopic review.

These analyses add structured computational evidence to the case. They are reported separately from the pathologist's final diagnosis and include their own methods, coverage, uncertainty, and limitations.

Study 01Model-derived

Histological subtype — attention-based MIL

An attention-based multiple-instance model over CONCH v1 patch features evaluates the distribution of evidence for candidate histological subtypes.

325 patches · 512 px · level 0 · 20× sampling
p(IDC)0.8216
p(ILC)0.1784
Top-10 attention mass24.2%
  • Shows how evidence is distributed across slide patches
  • Identifies the strongest supporting patch
  • Surfaces the strongest field arguing against the prediction
  • Requires confirmation by direct microscopic review
The probability is a model output, not a stand-alone subtype diagnosis.
Study 02Virtual phenotype

In-silico immunophenotype

A virtual multiplex-immunofluorescence model predicts a 20-marker panel from H&E and maps predicted phenotypes back to previously segmented nuclei.

GigaTIME-Flash · 43 cores · 11.517 mm² · 16,084 cells
CKCD3CD138CD68CD34
  • Reports predicted phenotype counts and proportions
  • Compares virtual phenotype with morphological classes
  • Highlights regions of agreement and divergence
  • Preserves model version, analyzed area, and coverage
No antibody was applied to the analyzed section. These are predicted marker intensities—not performed stains and not a replacement for validated IHC.
Illustrative report anatomy

From computational evidence to signed opinion.

The values below are a fictional presentation example—not a patient result or a claim of model performance.

TrueDx second-opinion consultationIllustrative breast core biopsy
DEMO
Pathologist impression

Invasive carcinoma is identified in the reviewed material.

Final subtype, grade, and biomarker interpretation require direct pathologist review and correlation with validated studies.

Evidence package7traceable artifacts
Tissue architectureComputed + reviewed
Stroma65.7%
Tumor15.9%
Necrosis2.9%
Tumor–stroma ratio0.80

Stroma-predominant field with focal tumor regions and patchy necrosis.

Cellular compositionComputed + reviewed
Total nuclei evaluated16,093
Tumor nuclei23.4%
Stromal nuclei74.7%
Analyzed area16.61 mm²

Marked regional heterogeneity is present; field-level values accompany the slide map.

Tumor-infiltrating lymphocytesComputed + reviewed
Lymphocytes + plasma cells1.9%
Peak regional fraction4.8%
PatternStromal

The illustrative field is lymphocyte-poor; representative support and counterexample regions are retained.

NecrosisComputed + reviewed
Classified tissue area2.9%
DistributionFocal
PatternPatchy

The most supportive region and a low-confidence counterexample are shown for pathologist verification.

SupportsRepresentative positive field

The image region that most strongly supports the stated finding.

ChallengesCounterexample field

The region that least supports or most strongly challenges the stated finding.

ResolvesPathologist judgment

The reviewer determines what is diagnostically valid and what must be excluded.

Homegrown models + Agentic Force

Generated, extracted, organized—then clinically reviewed.

Path23's homegrown AI models generate spatial predictions and extract tissue and cellular measurements. Agentic Force coordinates the artifacts, selects traceable supporting and opposing fields, drafts structured findings, and assembles them for review.

The pathologist remains the diagnostic authority.

  • AI outputs are clearly labeled as model-derived
  • Predicted biomarkers are not represented as performed stains
  • Uncertainty, coverage, and limitations remain visible
  • The pathologist may accept, modify, or reject every generated statement
  • Only the reviewed and signed report becomes the clinical opinion
Commercial demonstrations

See an evidence-rich report on an appropriate demonstration case.

Discuss laboratory onboarding, supported analyses, validation status, and report configuration with TrueDx.

Request a Path23 demonstration

Compose a demonstration enquiry

info@truedx.health

Do not email patient information or slide files.